
STEM-PDF
STEM Pair Distribution Function Mapping
Experimental characterization of heterogeneous nanostructured amorphous materials is challenging, because of the difficulty to image and describe disordered atomic arrangements at the nanometer scale. As an approach to provide fairly directly interpretable information on the structure of glasses, we developed a new TEM method to enable phase analysis and mapping of heterogeneous amorphous structures. We combine STEM diffraction mapping, pair distribution function (PDF) analysis, and hyperspectral analysis (Fig. 1-1). This approach allows to understand local structure variations in glassy composite materials and provides new insights to correlate structure and properties of glasses.

Figure 1-1: Schematic of RDF mapping: first a map of local diffraction patterns is aquired in micro probe STEM mode. Each map is processed to calculated the corresponding RDF. Multivariate statistical approach are then used to determine the principle components representing the RDFs for the area of interest and their distribution in the material.
To illustrate the capabilities of this new method, we have used STEM-PDF mappong to characterize an amorphous zirconiumoxide and zirconium iron multi-layer system and showed extreme sensitivity to small atomic packing variations. The new approach was not only able to directly reveal the structural differences between the ZrFe and the ZrO2 glas layers, but a thin interfacial layer could be detected (Figure 1-2).
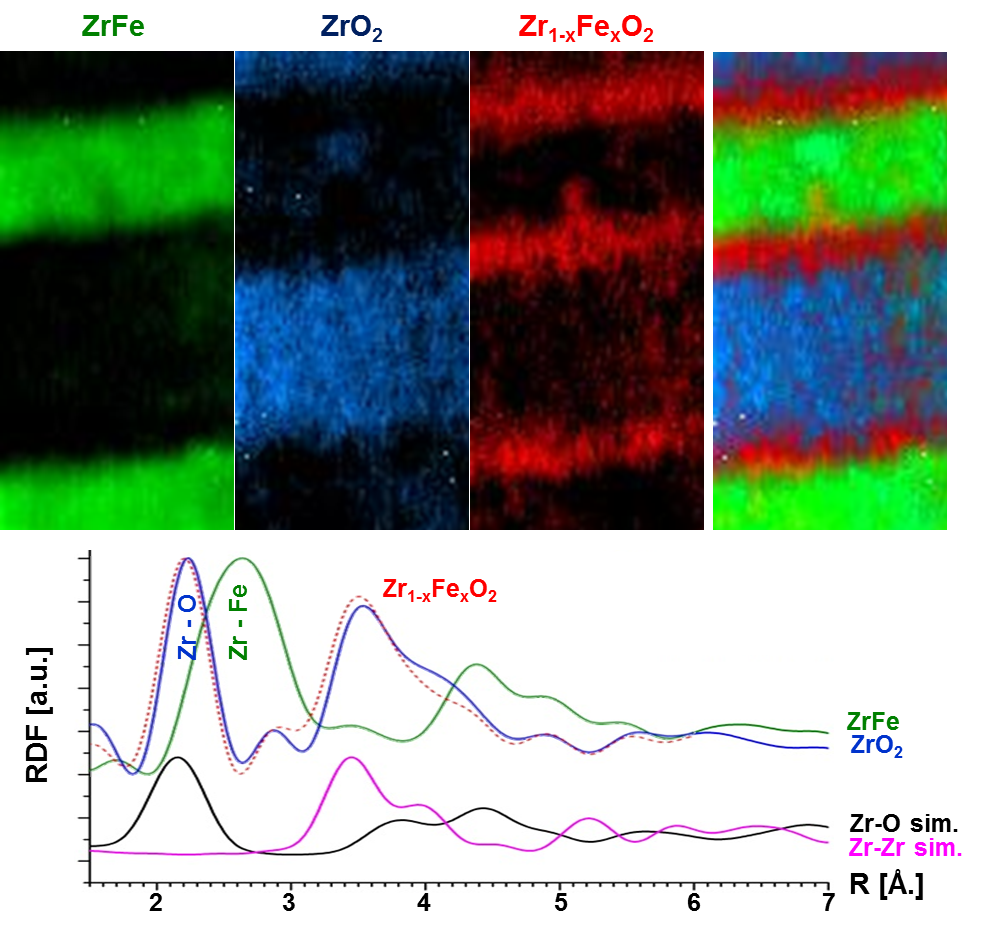
Figure 1-2: RDF mapping of a ZrFe/ZrO2 multi-layer glass with a 3-4 nm Zr1-xFexO2 intermediate layer. The RDFs at the bottom represent the characteristic atomic distanes of the glassy clusters forming the different glass layers.
More details on this work have been published at
- Radial distribution function imaging by STEM diffraction: Phase mapping and analysis of heterogeneous nanostructured glasses, X. Mu, D. Wang, F. Tao, C. Kübel, Ultramicroscopy, 2016, 168, 1-6; DOI: 10.1016/j.ultramic.2016.05.009.
Multivariate Statistical Analysis for STEM-PDF
Nanophases embedded in a matrix material, where their distribution and atomic structure play a significant role for the materials properties or devices function, are commenly encounter in materials research. However, experimental information about the individual phases cannot be be obtained without mixing other signlas due to the “projection problem” in (scanning) transmission electron microscopy (S/TEM). Lack of crystalline structure further increases the difficulty in understanding the data of conventional characterization techniques. Therefore, we have developed an approach using multivariate statistic analysis (MSA) for feature detection and “blind source separation” of mixed information in 4D-STEM data such as STEM-PDF for mapping atomic short- and medium-range order in amorphous materials.
The basic idea of multivariate statistical anaylsis (MSA) for feature detection is to solve the following equation:
X=FS
(mixed data = weighted factors multiplied by pure signals)
By using different criteria, MSA is divided into several methods, for example principle component analysis (PCA), independent component analysis (ICA), non-negative matrix factorization (NNMF) etc.
PCA determines orthonormal eigenvectors with the most significant eigenvalues as signal to filter for unexpected noise. It helps reduce the redundancy of mixed data and predicts the number of pure signals by judging the eigenvalues.
Inspired by the idea that the gaussianity of a mixture of pure signals is greater than the gaussianity of any pure signal, ICA focuses on minimizing the gaussianity of signals:

It can separate mixed signals reasonably and provide approximate solutions for the equation above.
In practice, many techniques always produce positive signals, e.g., EELS or EDX signals. NNMF adds extra constraints, so that the weight factors and pure signals are not negative to the optimization problem with the goal of minimizing the error:
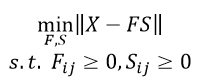
so that the results are physically meaningful.
Figure 2-1 shows how PCA analysis of STEM-PDF data followed by ICA to detect the indenpendent components is applied to the ZrO2/ZrFe multilayer system discussed above. The resulting 3 components can be clearly identified as FeZr, ZrO2 and a Marokite analog Fe3O4. Combining PCA and ICA thus enabled to overcome the projection problem and identify the individual pure phases.
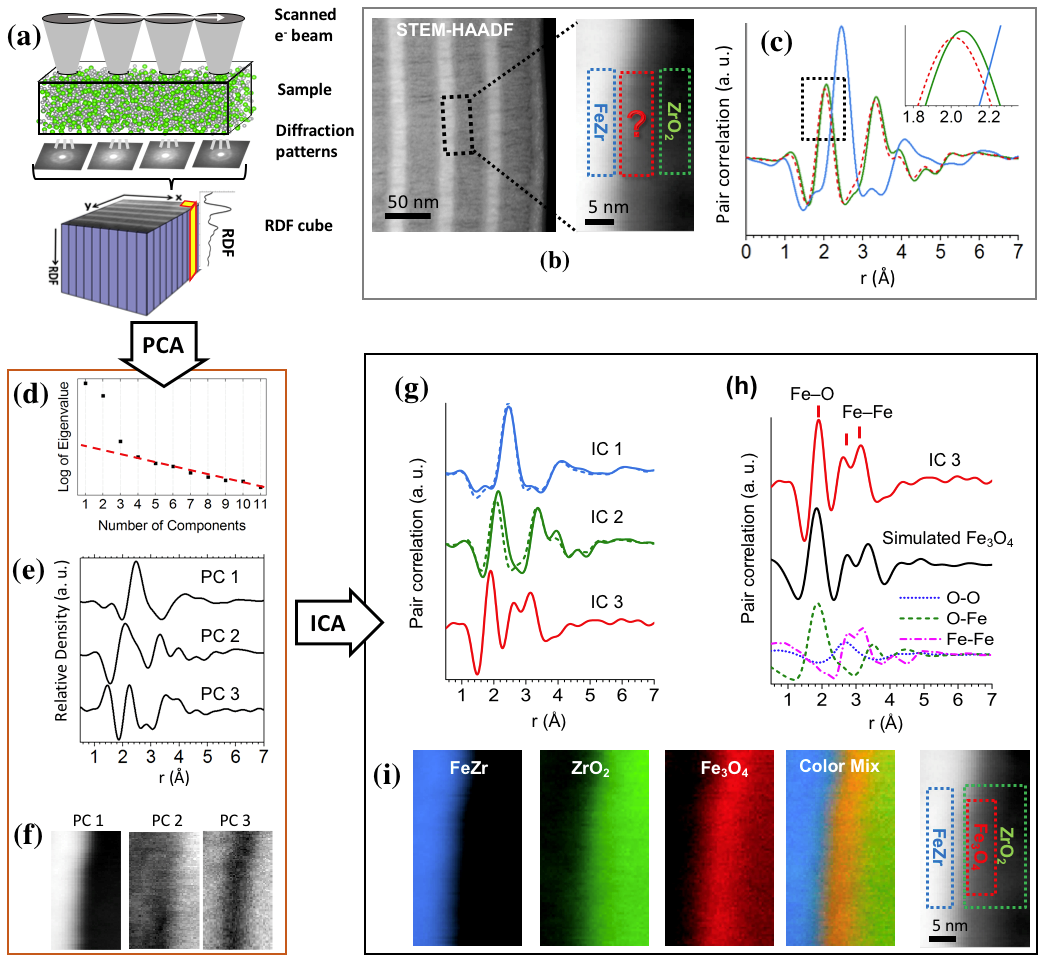
Figure 2-1: (a) Schematic depiction of STEM-PDF. (b) Left: conventional STEM-HAADF image of the amorphous ZrO2/FeZr multilayer. Right: virtual annular dark field (ADF) image obtained from the 4D-STEM data. (c) PDFs of FeZr layer (blue line), ZrO2 layer (green line) and the interfacial region (red dashed line) taken from the area indicated by the corresponding colored boxes in (b). PCA analysis results in the (d) scree plot, (e) PCs, and (f) their spatial distributions. (g) ICs (solid lines) resulted from ICA analysis of the PCA results, where IC1 and IC2 are compared to the PDFs of the FeZr layer (blue dashed lines) and ZrO2 layer (green dashed lines) taken from Figure 1c. (h) Comparison of IC3 (red solid line) and a simulated PDF based on crystalline Fe3O4 (Marokite, solid black line) and its partial PDFs. (i) Distribution map of the ICs and their correlation with the virtual ADF image.