
Organic Photovoltaics
In collaboration with the group of Alexander Colsmann at KIT, we use our recently developed 4D-STEM based pair distribution function (PDF) mapping to study organic photovoltaic nanocomposites with low electron dose. The P3HT/PCBM nanocomposite, which is used extensively in organic bulk-heterojunction solar cells, was selected as model system to illustrate the method. With a dose of 860 e/Å2 and a spatial resolution of 5.6 nm, to map the spatial distribution of P3HT and PCBM in a thin film (Figure 1 and 2) and recorded local PDF profiles in good agreement with existing models. The dose can even be reduced further depending on the local PDF quality required.
|
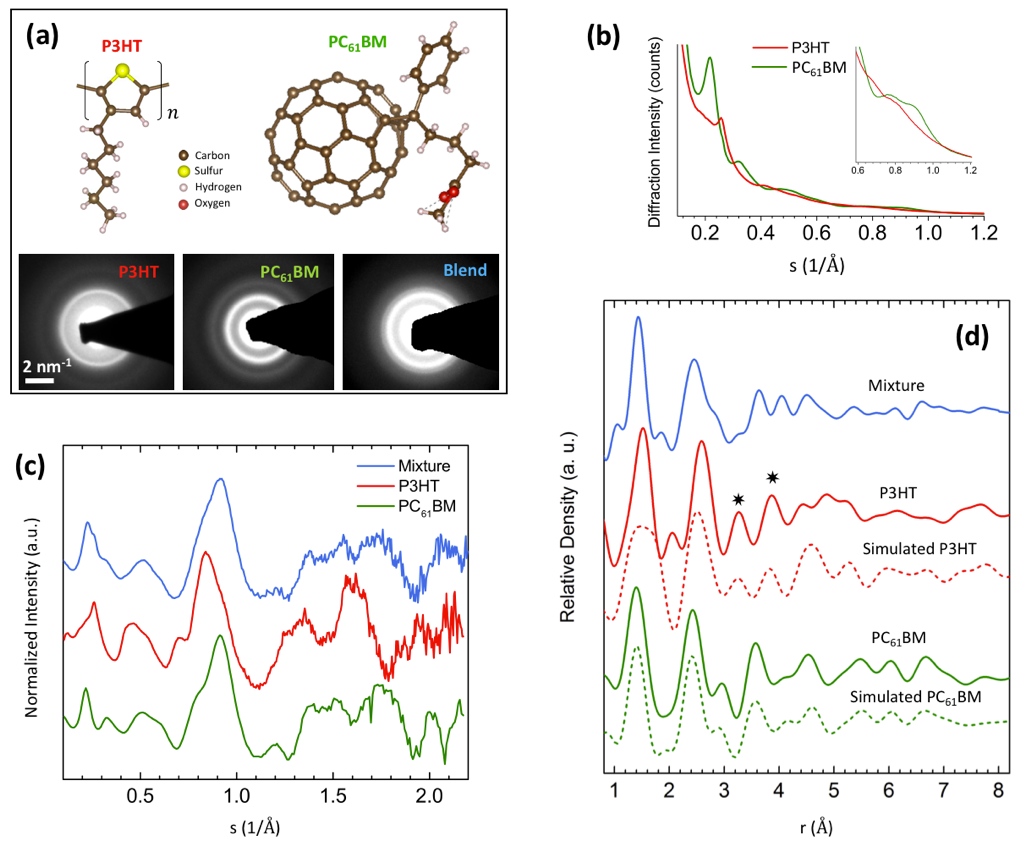
Figure 1. (a) Top: Atomic structure of a single P3HT repeat unit (left) and PC61BM (right). Bottom: SAED patterns of the P3HT (left), PC61BM (middle) and their blend (right). (b) Diffraction profiles of P3HT (red line) and PC61BM (green line) by azimuthal integration of the SAED patterns. (c) Structure factors of the blend (top, blue line), P3HT (middle, red line) and PC61BM (bottom, green line) derived from experimentally measured SAED patterns. (d) From top to bottom, the experimental PDFs of the blend (blue solid line), P3HT (red solid line), simulated PDF according to crystalline P3HT model59 (red dashed line), experimental PDF of PC61BM (green solid line) and simulated PDF according to PC61BM molecular model (green dashed line). |
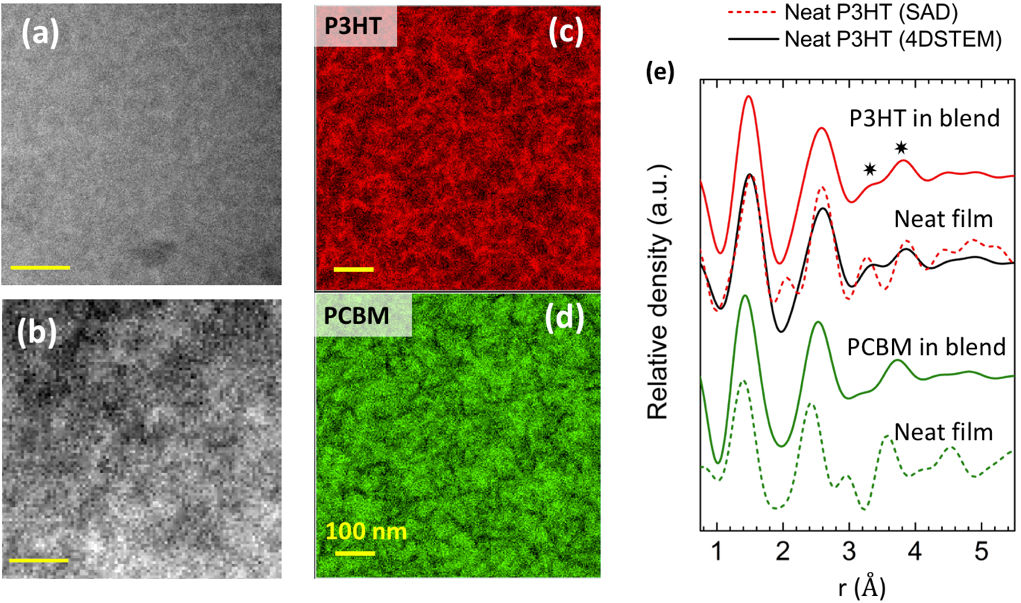
Figure 2. (a) A typical (HR)TEM bright field image of the blend film. (b) Virtual STEM HAADF image. (c) PDF maps of PC61BM and (d) the P3HT phase at the same location as in b. (e) PDFs of the P3HT-rich (blue red solid line) and PC61BM-rich (red green solid line) phases of the blend extracted from the STEM-PDF cube. PDFs of the neat P3HT (blue red dashed line) and PC61BM (red green dashed line) films obtained by using the SAED microscope setup. Black solid line is the PDF of the neat P3HT film obtained using the STEM-PDF microscope setup. All scale bars are 100 nm. |
Moreover, we performed a systematic study of electron beam induced degradation of P3HT by monitoring the structural transitions based on the changes in the PDF profile: the degradation started with a cleavage of the aliphatic side chains, which enabled a rotation of the polymer chain before it was fragmented at very high dose giving rise to a partially carbonized material.
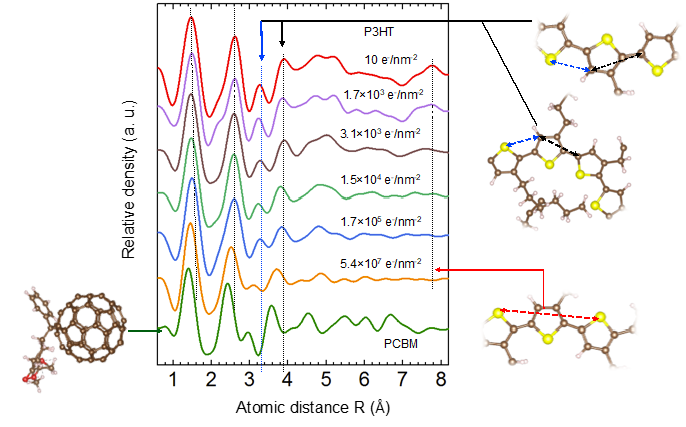
Figure 3. Test of the beam induced structural changes in the neat P3HT film measured at 300 keV acceleration voltage with varying dose.
STEM-PDF mapping can potentially be further extended to even study local variations in the atomic configuration of a polymer.
Details for this work are published at
- X. Mu, A. Mazilkin, C. Sprau, A. Colsmann, C. Kübel, Mapping structure and morphology of amorphous organic thin films by STEM pair distribution function analysis, Microscopy, 2019, 68(4), 301-309.