
Multiscale Materials Modelling and Virtual Design
Welcome to the website of Prof. Wolfgang Wenzel's Research Group focused on the "Multiscale Materials Modelling and Virtual Design", one of the topics researched at the Institute of Nanotechnology (INT) at the Karlsruhe Institute of Technology.
We develop and apply methods for multi-scale simulations of nanoscale materials and devices.
linkCarl-Zeiss Foundation Center for “Synthetic Genomics – writing the code of life”
link
The performance of a photoinitiator is key to control efficiency and resolution in 3D laser nanoprinting. Upon light absorption, a cascade of competing photophysical processes leads to photochemical reactions toward radical formation that initiates free radical polymerization. This study explores the mechanisms of photoactivation and radical formation during 3D laser printing using photoresists with a DETC photoinitiator. The role of DETC in high triplet states during radical polymerization is revealed.
Article
We are proud to be part of the excellence cluster 3D Matter Made to Order (3DMM2O).
3D Matter Made to Order
The Deutscher Akademischer Austauschdienst (DAAD) offers scholarships to international students pursuing PhD studies in Germany. Details about these scholarships are available in the DAAD Scholarship Database. If you are interested in this funding opportunity and need guidance with your research project proposal, please contact: helmy.hernandez@kit.edu
DAAD Scholarship Database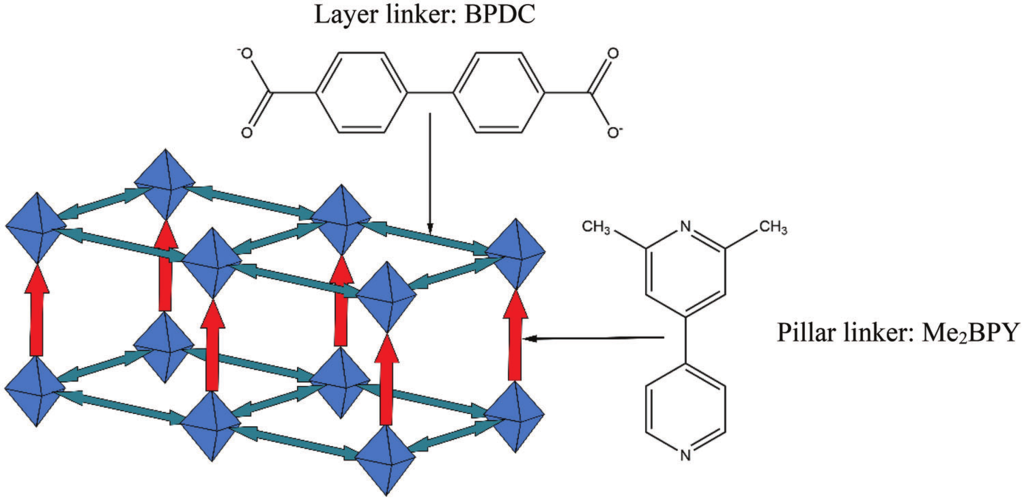
Herein, a multiscale modelling approach is presented for in-silico SURMOF assembly to identify and overcome limitations in the growth of pillar-layered SURMOFs and to develop a strategy to maximize linker alignment. Using master equation models and kinetic Monte Carlo simulations, it is found that the formation of a highly ordered state corresponding to the thermodynamic equilibrium is often prevented by long-lasting transient effects. Based on ab initio binding energies for a wide selection of hypothetical pillar linkers, a fast-binding, slow-relaxation scheme is able to be identified during the SURMOF growth for a range of different pillar linkers. These observations allow them to derive a rational strategy for the design of novel linkers to yield SURMOF-based non-centrosymmetric materials with substantially improved properties.
Adv. Fun. Mat., DOI: 10.1002/adfm.202302516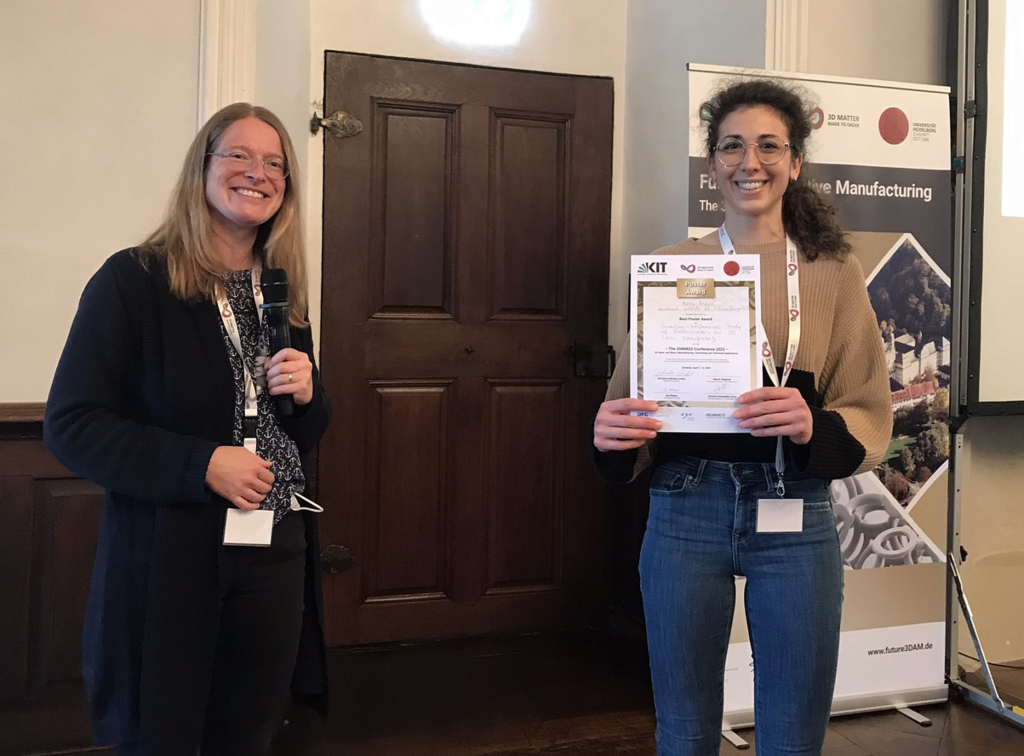
Congratulations to our PhD student Anna Mauri for the Best Poster Award at Future 3D Additive Manufacturing - The 3DMM2O Conference 2022! The awards were presented by Conference chair Christine Selhuber-Unkel, Principal Investigator in 3DMM2O Cluster of Excellence.
Anna has presented a poster entitled: "Quantum-mechanical study of photoinitiators for 3D laser nanoprinting", where she has explaned the multiphoton activation of different photoinitiators used in 3D laser nanoprinting and the mechanism of their radical formation that she is investigating under the supervision of Dr. Mariana Kozlowska in collaboration with AG Wegener and AG Barner-Kowollik.
PhD. Student Anna Mauri
This roadmap presents the transformational research ideas proposed by “BATTERY 2030+,” the European large-scale research initiative for future battery chemistries. A “chemistry-neutral” roadmap to advance battery research, particularly at low technology readiness levels, is outlined, with a time horizon of more than ten years. This roadmap should be seen as an enabling complement to the global battery roadmaps which focus on expected ultrahigh battery performance. Lithium-ion batteries will soon approach their performance limits, but through this “chemistry neutral” approach a generic toolbox transforming the way batteries are developed, designed and manufactured, will be created.
Adv. En. Mat., DOI: 10.1002/aenm.202102785Modeling and simulation of materials have become indispensable to complement experiments in materials design, aiding researchers in selecting the most promising materials for experimental studies or providing insights inaccessible by experiment. This often requires multiple simulation tools, so methods and tools are needed to enable extensive-scale simulations with streamlined execution of all tasks within a complex simulation protocol. These methods should allow rapid prototyping of new protocols and proper documentation of the process. We present an overview of the benefits and challenges of workflow engineering in virtual material design and a selection of prominent scientific workflow frameworks used for the research in the BATTERY 2030+ project.
Adv. En. Mat., DOI: 10.1002/aenm.202102638SimStack facilitates the efficient implementation, adoption and execution of complex and extensive simulation workflows and enables fast uptake of modeling techniques for advanced functional and nanomaterials by industry. Within a few hours, complex modeling solutions are rendered into easy-to-use, scalable, marked-ready software products, circumventing time-consuming workflow setup and execution by industrial R&D. SimStack provides a highly flexible drag-and-drop environment that allows quick adaption of existing workflows to develop custom-tailored solutions that meet the end-user’s needs, as well as a graphical user interface for the end-user to automatically execute the workflows on remote computational resources.
Download Simstack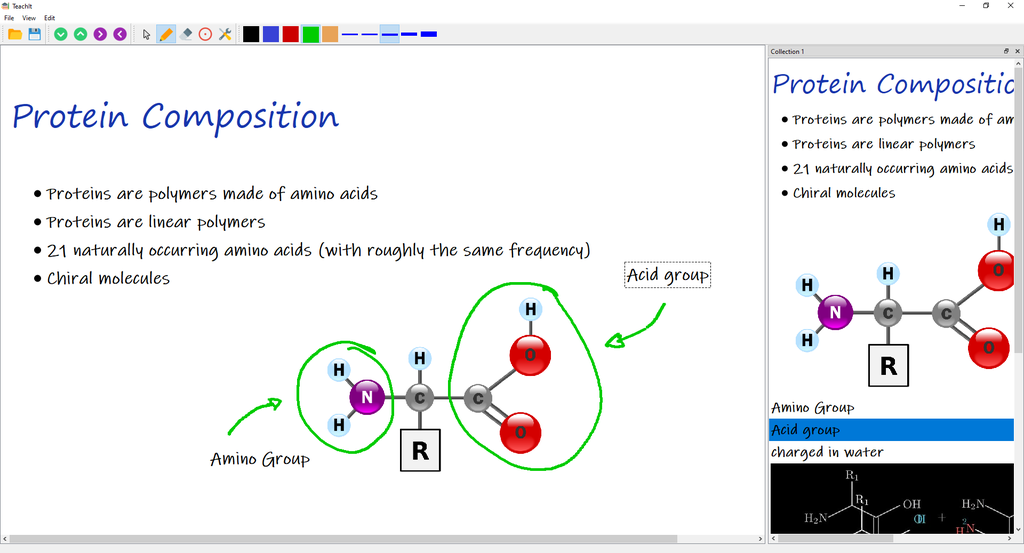
Nearly two years of teaching in the pandemic have taught us that it is difficult to capture the attention of our students in online teaching using conventional tools. TeachIt takes a fresh approach by providing a digital teaching whiteboard. This app emulates a whiteboard for the student, while permitting the teacher to preformulate and reuse teaching content.
Teachit combines the ease of use and comfort of PowerPoint with the dynamic impression of a blackboard as in presence classroom. TeachIt can be used both for online teaching and in the classroom (with a beamer).
Get Teachit Now
A completely new and modular receptor design strategy based on microporous hybrid materials is presented yielding zeolite-based artificial receptors (ZARs) which reversibly bind the neurotransmitters serotonin and dopamine with unprecedented affinity and selectivity even in saline biofluids. ZARs are thermally and chemically robust, can be readily prepared at gram scales and their applicability for the label-free monitoring of important enzymatic reactions, for (two-photon) fluorescence imaging, and for high-throughput diagnostics in biofluids is demonstrated.
Adv. Mat., DOI: 10.1002/adma.202104614
Graphene is inherently sensitive to vicinal dielectrics and local charge distributions, a property that can be probed by the position of the Dirac point in graphene field-effect transistors.Mmetal–organic frameworks can be tailored to selective adsorption of specific molecular species. Here, a selective ethanol sensor is demonstrated by growing a surface-mounted metal–organic framework (SURMOF) directly onto graphene field-effect transistors (GFETs). Tailoring multiple SURMOFs to adsorb specific gases on an array of such devices thus generates a versatile, selective, and highly sensitive platform for sensing applications.
Adv. Mat., DOI: 10.1002/adma.202103316
Jun.-Prof. Dr. Pascal Friederich
In aggregated organic semiconductor (OSC), charge carrier mobility is determined by inter-chromophoric electronic and vibrational coupling, which depend on structural properties, including the density of defects. A new type of crystalline assembly strategy has been employed to engineer the arrangement of the OSC pentacene in a structure not realized as crystals to date. Using multiscale approach, we have proven the intrinsic rotational motion of the (rigid) pentacene strongly suppresses charge delocalization, suggesting the charge transport mechanism in this metal–organic framework (MOF), at the borderline between the localized hopping and delocalized charge transport. This opens new startegies towards enhancement of semiconducting properties of MOFs.
Chem. Sci., DOI: 10.1039/D0SC07073D
Understanding triplet exciton diffusion between organic thermally activated delayed fluorescence (TADF) molecules is a challenge due to the unique cycling between singlet and triplet states in these molecules. Singlet and triplet diffusion lengths can be accurately determined from experimental data. Theory confirms that the lack of overlap between the shielded lowest unoccupied molecular orbitals hinders triplet motion between TADF chromophores in such molecular architectures.
Chem. Sci., DOI: 10.1039/D0SC05190J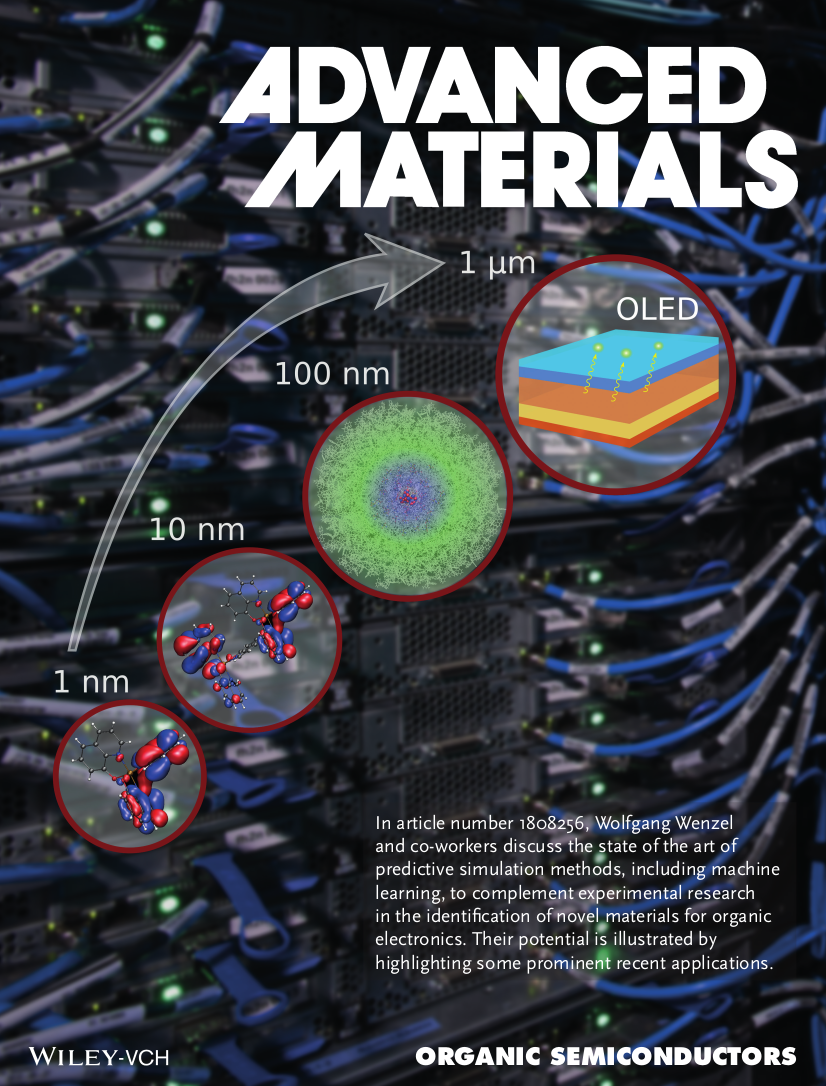
Organic semiconductors are widely used in prominent applications such as organic light‐emitting diode displays and organic solar cells. The state of the art of predictive simulation methods is discussed, including machine learning, to complement experimental research in the identification of novel materials in the vast available chemical space, and their potential is illustrated with a few prominent recent applications.
Adv. Mat., DOI: 10.1002/adma.201808256
Nanocrystalline graphene shows significantly different high-temperature behavior compared to pristine graphene. In this work we analyze the dynamics of graphene formation during in situ heating experiments. Therefore, we combine high-throughput transmission electron microscopy and computational modeling to get an insight into fundamental processes. We observe that the reactive nature of unsaturated edges and defects in nanocrystalline graphene enables various temperature-driven rearrangement mechanisms.
Nanoscale Adv., DOI: 10.1039/C9NA90036E
The last decades brought a massive development of simulation methods for materials science, chemistry and soft matter applications, now being efficient and accurate for the targeted application area. In this RTG we will systematically investigate problems, which are not addressable by standard tools from the quantum chemistry toolbox. The research is organized into seven projects, where five projects address scientific challenges like friction, materials aging, material design and biological function, which so far cannot be approached by single computational methods or standard multiscale approaches. The challenges are met, (i) by building teams which cover all knowledge and methods required to address scale-bridging problems, (ii) by a research program, which aims at a novel holistic, problem-driven approach to combine existing methods on the individual scales to recursive scale-bridging workflows and (iii) by training doctoral researchers, who are enabled to apply scale-bridging concepts and technical skills needed for such a problem-driven approach.
GRK 2450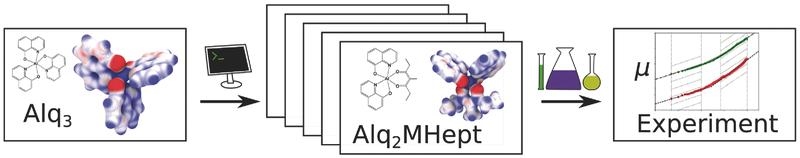
The viability of a multiscale simulation approach to rationally design organic semiconductors with improved electron mobility is demonstrated. Novel materials with tailored electronic properties are designed for which an improvement of the electron mobility by three orders of magnitude is predicted and experimentally confirmed.
Adv. Mat, DOI: 10.1002/adma.201703505
Proton‐conducting molecules in the pores of metal–organic frameworks change their conductivity upon photoswitching the host framework. In this work, irradiation with light (green) causes trans–cis isomerization of the azobenzene components of the framework, switching the molecular interaction and the conductivity of the triazole guest molecules (center). The sample is mounted on interdigitated gold electrodes, which are used for measuring the conductivity.
Adv. Mat., DOI: 10.1002/adma.201706551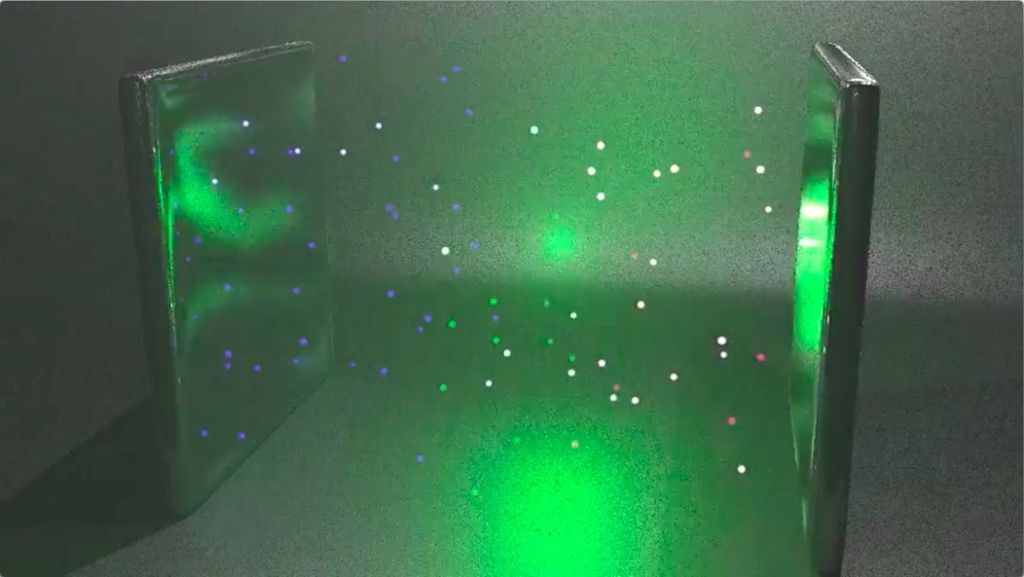
This video illustrates the principle of OLED devices. Electrons and holes are injected at the electrodes, drift through the device and emit light when they recombine. The charge carrier movement in a real device can be simulated using the kinetic Monte-Carlo method, which has been implemented in our group.
Video posted on YouTube