Electron Tomography Developments
The 2D images typically obtained in SEM and TEM analysis are insufficient to understand and quantify details of complex 3D nanostructures and morphologies. Electron tomography techniques have been developed to overcome this limitation by reconstruction the full 3D structure using (S)TEM tomography or FIB Slice&View approaches. Our research focuses on further improving the reliability and quantitative analysis and extending it towards in situ characterization. The aim is to correlate the physical and chemical properties of materials in catalysis, energy transformation and energy storage applications with transport processes in the materials.
Introduction
Electron tomography uses a series of projections over a wide angular range to reconstruction the 3D representation of the imaged object. A typical workflow for tomography includes tilt series acquisition, alignment, reconstruction and 3D visualization, as shown in Fig. 1.
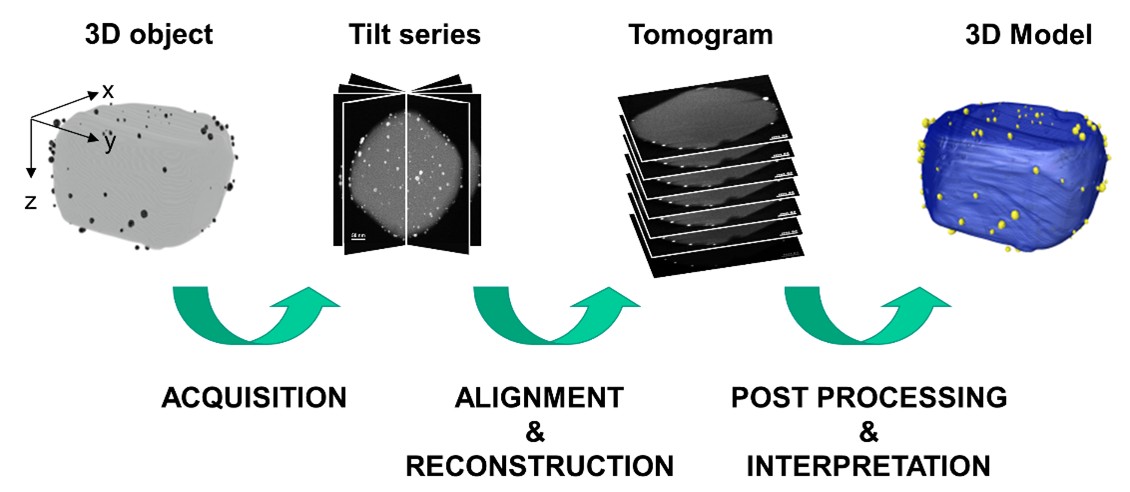
Figure 1: Schematic representation of a tomographic reconstruction: 1) acquisition of projection images at different tilt-angles, 2) alignment and reconstruction, 3) post processing and visualization.
The prerequisite for the proper 3D reconstruction is so called “projection requirement”, which states that the projected signal for electron tomography must be a monotonic function of a physical property of the sample under investigation, e.g. density, thickness, magnetic or electrical properties. Satisfying the projection requirement, various signals can be acquired in tile series, such as TEM, BF-DF/HAADF STEM, EDX and EELS spectrum imaging. To ensure a high-quality 3D reconstruction, the acquired tilt series must be aligned to a common coordinate system corresponding to a well-defined axis with sub-pixel accuracy, by e.g. cross-correlation, center of mass and fiducial marker tracking as the most commonly used methods. With fiducial marker tracking, using e.g. IMOD, it is also possible to correct to a certain extent for image distortions, tilt axis orientation, inaccuracies of the tilt angle, magnification variations etc. therefore, producing more accurate alignment.
Various reconstruction algorithms can be applied in electron tomography, including e.g. (weighted) back projection, iterative reconstruction methods such as ART and SIRT, and advanced iterative reconstruction methods using prior knowledge like TVM and DART.
The resolution of the reconstructed tomogram, first of all, depends on the resolution of the instrument and the imaging mode. Additionally, in the direction perpendicular to the tilt axis X and the optical axis (Z), the resolution is limited by the sampling rate N and the dimension of the material D.

In the direction parallel to electron beam, the resolution is further reduced due to the missing wedge, which can be expressed by multiplying the resolution in the Y direction by an elongation factor (eyz). This can be expressed as:
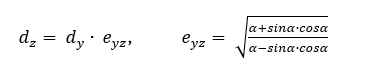
where α is the maximum tilt angle, directly determining the value of eyz.
The effect of angular sampling and missing wedge can be clearly described by the Fourier/central slice theorem, which states that the Fourier transform of a 2D projection at an angle θ is a central section through the Fourier space of the 3D object at the same angle. As shown in Fig. 2, recording projections at various tilt angles is then equivalent to sampling 3D Fourier space at the corresponding angles. Therefore, a limited tilt range during the acquisition results in a missing wedge of information in the 3D Fourier space. In addition, the discrete angular increment will result in a higher sampling density at low spatial frequencies than at high spatial frequencies, resulting in a blurring of the reconstruction.
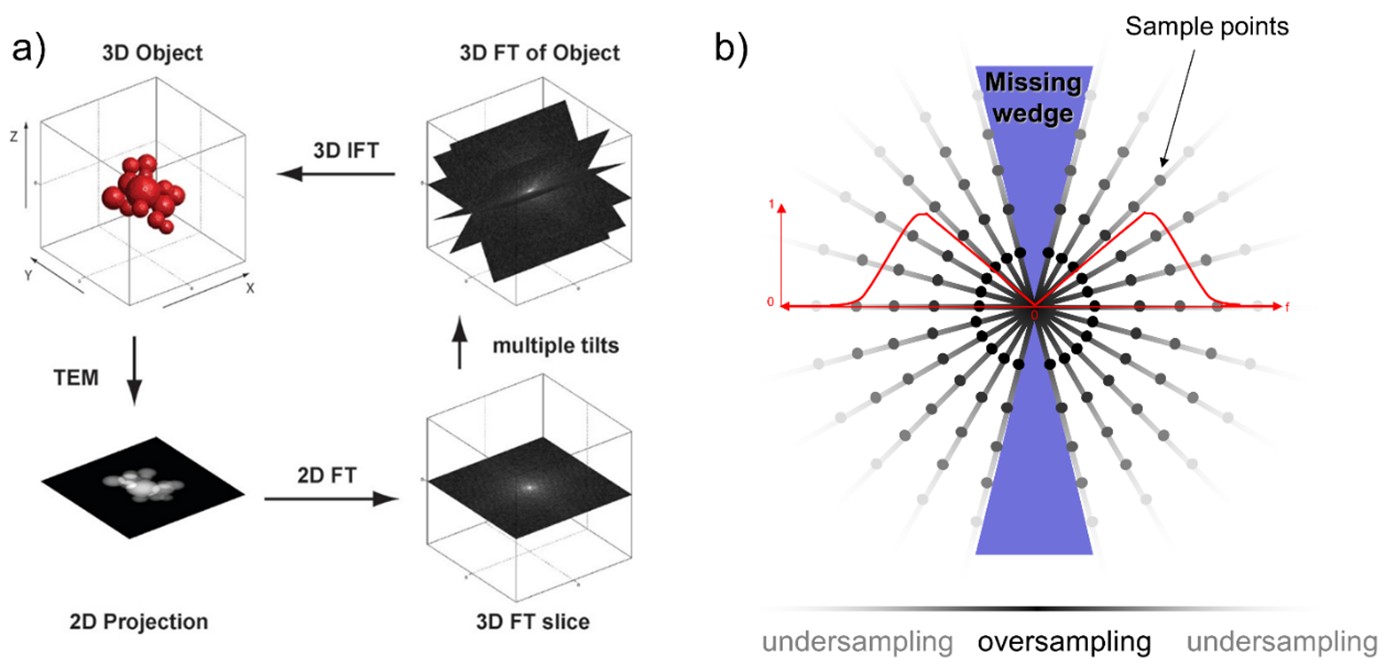
Figure 2: Schematic representation of (a) Fourier slice theorem from Friedrich et al. (2009) Chem.Rev., 109: 1613, and (b) missing wedge from limited angular sampling
Methodology
The quality and reliability of the 3D reconstruction depends crucially on
1) the quality of the input images
2) the alignment accuracy
3) angular sampling and coverage
4) the reconstruction algorithm
Applications
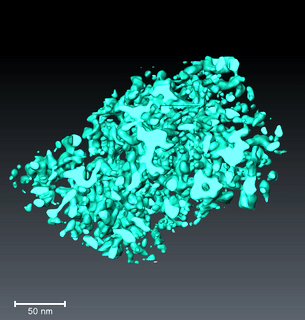
We have used electron tomography for a wide range of materials science applications ranging from catalysis, to quantum dots, to polymer composites and semiconductor structures. A few of these examples are shown here to illustrate the potential that electron tomography offers.
|
|
Fig. 4: Surface rendering of a bicontinuous block-copolymers with single layer exfoliated silicates. |
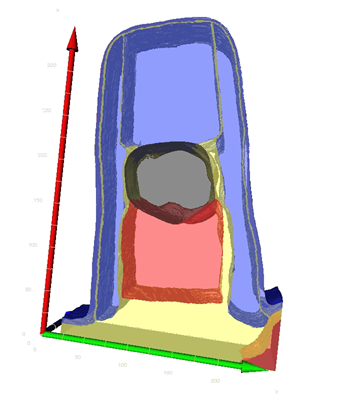
Fig. 5: Surface rendering of a DRAM transsistor. The gate oxide as well as ~1.5 nm oxynitride layers are visible in the 3D reconstruction. |
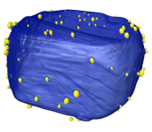
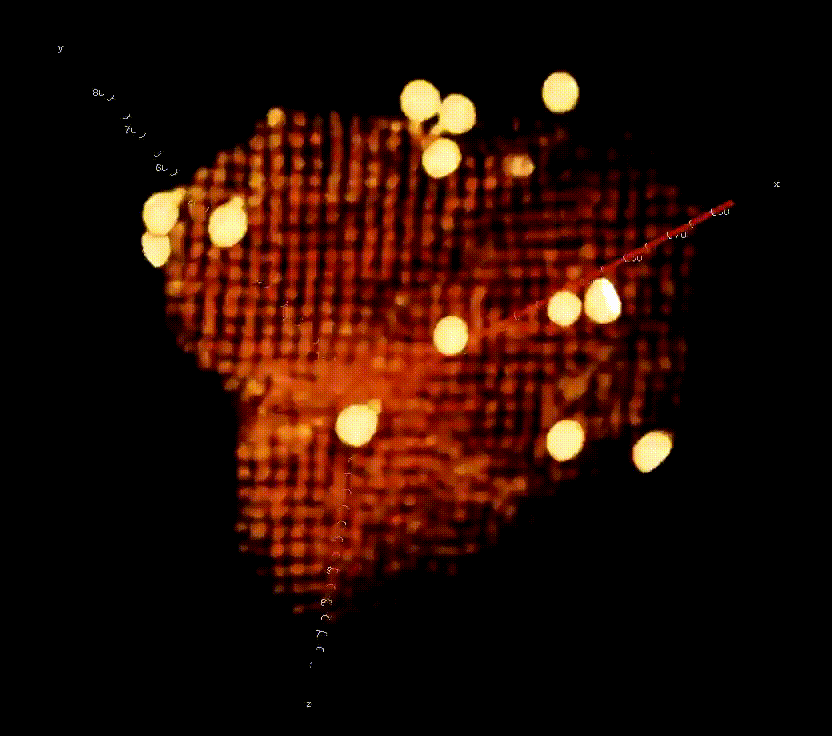 Fig. 3: Volume rendering of a superlattice formed by CdS quantum dots. The lattice parameters of the cubic lattice were determined to be 3.2 nm. Individual supperlattice defects such as vacancies and dislocations could be imaged in 3D. The 'large' yellow particles are 5 nm gold labels.