
Advanced Algorithms and Quantitative 3D Analysis
Transmission electron microscopy (TEM) tomography has become one of the most powerful tools for resolving complex mesoporous structures in three dimensions. Unlike bulk techniques such as physisorption or small-angle scattering, electron tomography (ET) does not require a priori assumptions about pore shape or connectivity. Instead, it reconstructs the pore network directly at nanometer resolution. Yet the promise of quantitative 3D analysis depends critically on one factor: the fidelity of the reconstruction and its segmentation.
In mesoporous materials, where pore diameters range from 2 to 50 nm and structures are often highly disordered, even subtle reconstruction artifacts can propagate into large errors in calculated morphology and transport properties. The central question is no longer whether tomography can image pores — but whether it can quantify them reliably.
Reconstruction Algorithms
Electron tomography is inherently limited by incomplete angular sampling (the “missing wedge”), finite projection numbers, noise, and alignment errors. Classical reconstruction approaches such as the Simultaneous Iterative Reconstruction Technique (SIRT) are widely used but suffer from grey-level variations and elongation artifacts, especially under limited tilt ranges.
Advanced algorithms aim to mitigate these limitations. Total Variation Minimization (TVM) introduces regularization constraints to suppress noise and enhance piecewise-constant regions. The Discrete Algebraic Reconstruction Technique (DART), in contrast, integrates segmentation directly into the iterative reconstruction by incorporating prior knowledge of discrete grey levels corresponding to distinct material phases
Phantom studies where synthetic 2D and 3D pore structures serve as ground truth provide a rigorous framework to evaluate algorithmic fidelity. These simulations reveal that DART consistently outperforms SIRT and TVM in recovering small pores and narrow channels, particularly when projections are limited or when a significant missing wedge is present. While SIRT reconstructions exhibit elongation artifacts and misclassification of narrow connections, DART preserves connectivity and reduces misclassified voxels even under noisy conditions.
Importantly, reconstruction accuracy is not solely determined by the algorithm itself. Parameter optimization — including smoothing kernels, iteration numbers, and threshold selection — strongly affects segmentation fidelity. Quantitative metrics such as the relative number of misclassified pixels (rNMP) allow objective comparison between reconstruction strategies
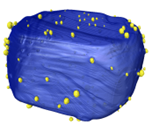
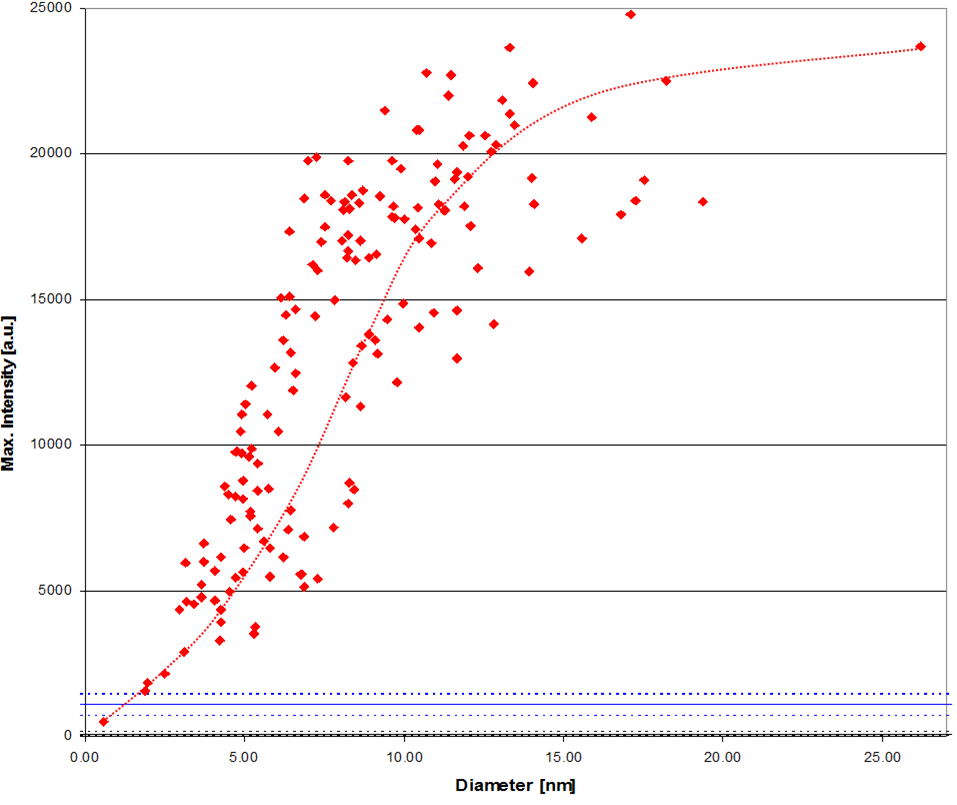 Fig. 13: 3D reconstruction of metal nanoparticles on a catalyst support. The graph shows the experimental correlation between particle size and reconstructed average intensity of the particles (from C. Kübel, D. Niemeyer, R. Cieslinski, S. Rozeveld, J. Mat. Sci. Forum, 2010, 638-642, 2517-2522).
High-fidelity reconstruction is essential because quantitative 3D analysis directly depends on segmentation quality. In experimental mesoporous carbon, reconstructed volumes were analyzed via skeletonization and chord length distribution (CLD) methods to extract pore diameter, pore length, coordination number, and tortuosityEven small segmentation errors propagate into these descriptors, affecting derived properties such as accessible pore volume and structural homogeneity.
The impact extends further to transport modeling. Random-walk diffusion simulations performed within segmented 3D volumes show that inaccuracies in pore connectivity or constrictions alter calculated effective diffusion coefficients . Algorithms that better preserve narrow bottlenecks and suppress missing-wedge artifacts therefore provide more reliable structure–property correlations.
Advanced algorithms thus redefine quantitative TEM tomography. Reliable 3D metrology requires controlling Fourier sampling imbalance, stabilizing voxel intensities, and integrating segmentation-aware reconstruction strategies. Only through this computational rigor can mesoporous structures be translated into accurate morphological and transport descriptors.
Details and further work are published at:
- Quantitative Analysis of Mesoporous Structures by Electron Tomography: A Phantom Study, X. Huang, D. Hlushkou, D. Wang, U. Tallarek, C. Kübel, Ultramicroscopy, 2023, 243, 113639; DOI: 10.1016/j.ultramic.2022.113639.
- Quantifying Morphology and Diffusion Properties of Mesoporous Carbon From High-Fidelity 3D Reconstructions, W. Wang, A. Svidrytski, D. Wang, A. Villa, H. Hahn, U. Tallarek, C. Kübel, Microscopy & Microanalysis, 2019, 25, 891-902; DOI: 10.1017/S1431927619014600.